Something On Infographics
August 23, 2015
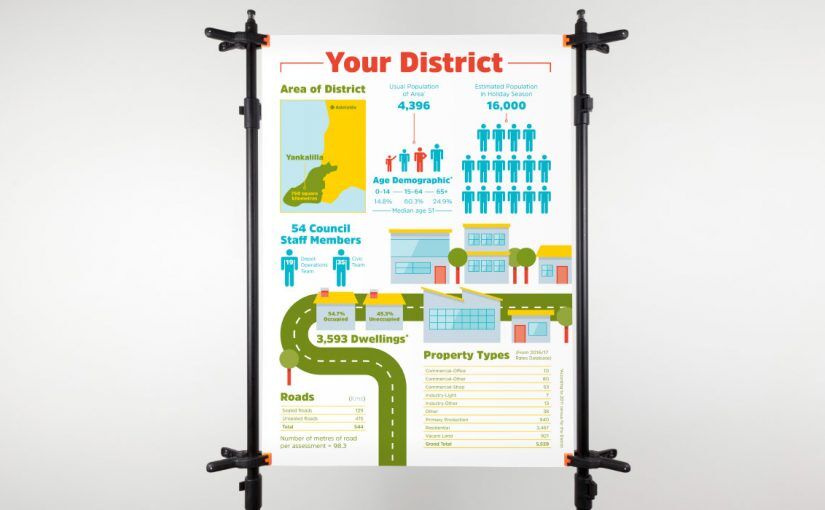
Infographics are graphic visual representations of information, data or knowledge intended to present complex information quickly and clearly. Infographics are very beneficial in communicating information and thereby encouraging people to read data that might otherwise be lost in a table or in blocks of text. This infographic we created for the District Council of Yankalilla is a good example of how a rather uninteresting topic can be brought to life with a simple and easy to understand graphic, in this instance the breakdown of the Council area.
Infographics can also assist readers in seeing the patterns or trends within data, or more readily quantifying large numbers in terms of smaller element groups to represent tens or thousands of individual elements.